Free
For developers getting started with thread dump analysis.
- 3 analyses per day
- Interactive visualizations (flame graph, call tree)
- 1 user, 1 personal workspace
- 30 analyses in history
- Deadlock / CPU spike detection
- Link sharing
- Files up to 10 MB
Usamos cookies essenciais para login e armazenamento local para suas preferências. Para métricas de uso, usamos o Google Analytics 4 — você pode recusar sem perder nada do produto. Saber mais
Mine the signal.
Skip the noise.
The product in 20 seconds
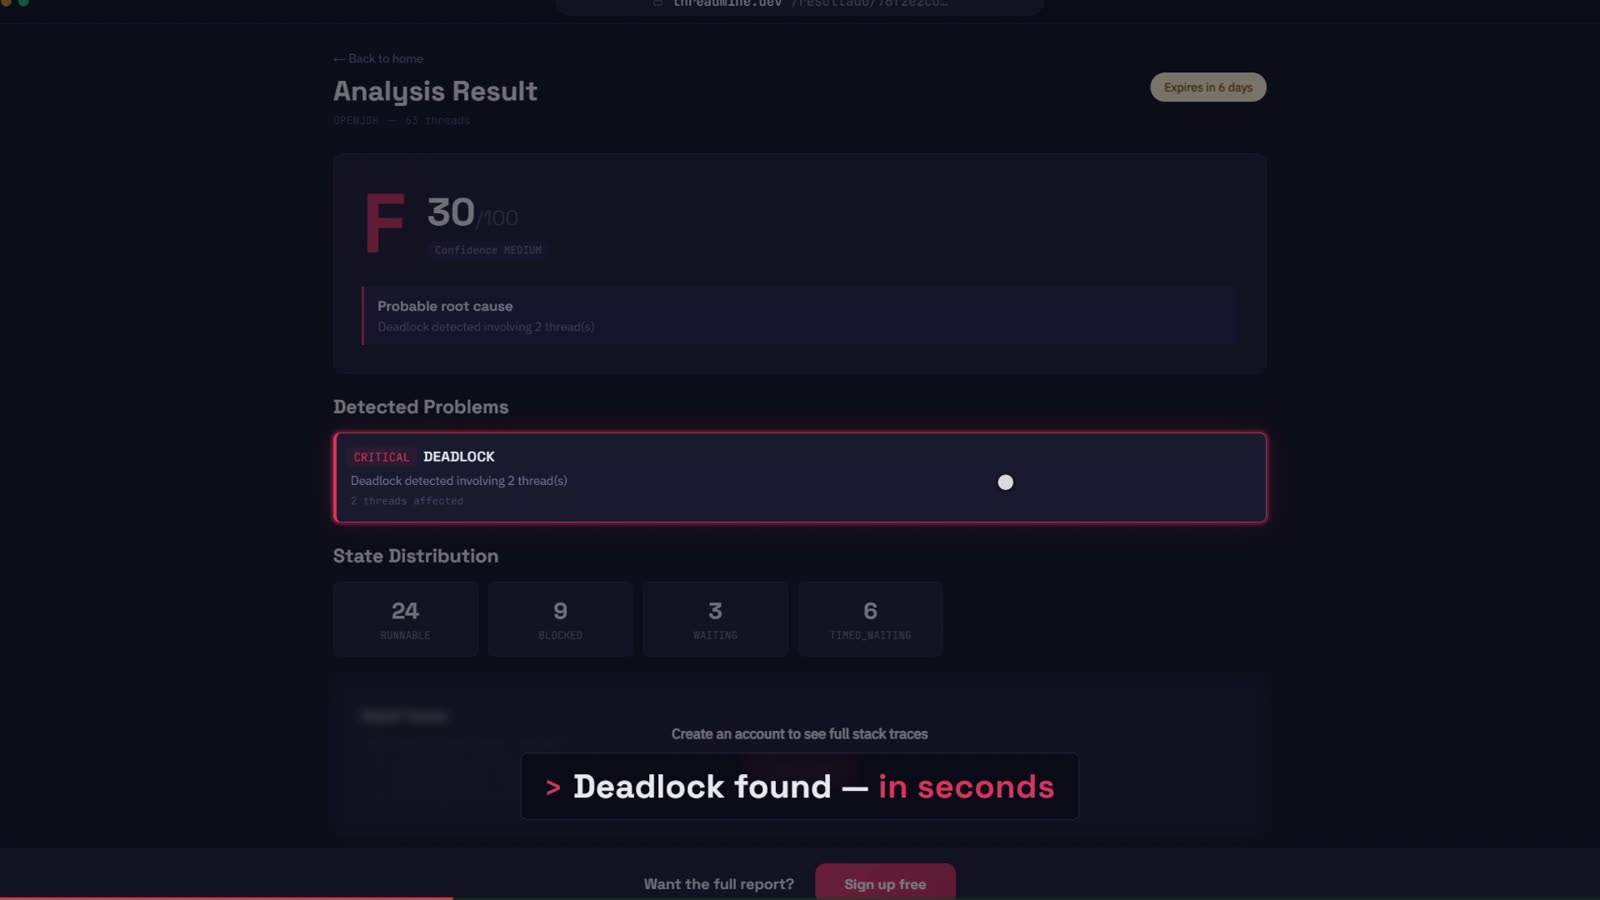
A real capture of the no-account flow: drop a dump and watch the grade and the critical deadlock surface.
Interactive demo
Problems solved
From silent deadlocks to virtual thread leaks — we pinpoint the root cause in seconds, not hours.
Two or more threads waiting on each other's locks forever. Your application freezes with no visible error — hours of silent downtime.
A thread in busy-wait or an infinite loop consuming 100% of a core. Cloud costs skyrocket while latency steadily degrades.
High-priority threads monopolize resources while critical tasks wait indefinitely in the executor queue.
Blocking cascades where dozens of threads wait on a single monitor. One bottleneck becomes an avalanche of timeouts for the end user.
HTTP requests that never return. Servlet container threads stuck on external calls with no timeout configured.
Threads created with new Thread() and no pool or lifecycle management. The count grows until OutOfMemoryError brings the JVM down.
Executor pool 100% busy with threads waiting on slow I/O. New tasks rejected, no CircuitBreaker, cascading failures.
Synchronized blocks or ReentrantLocks contended by multiple threads. Throughput plummets even with healthy CPU and I/O.
Virtual threads pinned in synchronized blocks, monopolizing carrier threads. Java 21+ with virtual threads demands special attention.
How it works
Drag your thread dump file or paste the jstack output directly. We support .txt, .log, .tdump and .zip.
Our AI identifies patterns, correlates threads, detects locks and ranks problems by severity in under 3 seconds.
Get a detailed diagnosis, annotated stack traces, actionable recommendations and an exportable report for your team.
ThreadMine vs competitors
| Feature | ThreadMine | fastthread.io | JStack Review | TDA |
|---|---|---|---|---|
| Vein (generative AI) | ||||
| Virtual Thread / Java 21+ | ||||
| Thread leak detection | ||||
| REST API + CI/CD integration | ||||
| Exportable report (PDF/JSON) | ||||
| History and comparison |
Why ThreadMine
Capture in production, diagnose with AI, compare, watch it evolve, and share with your team. One hosted product with a real free tier — not an analyzer that forgets everything when you close the tab, nor a $1,000/month on-prem dashboard.
Upload a standard Java 21+ dump and ThreadMine flags pinning, carrier-thread starvation, and virtual-thread leaks — automatically, without enabling -Djdk.tracePinnedThreads. Elsewhere, that's a manual JVM-flag workflow described in blog posts.
Stitch several dumps of the same incident into one evolution and let ThreadMine flag the inflection point where things started going wrong — on its own. Showing dumps side by side, others do; pinpointing the turn, they don't.
Vein isn't a generic chat: it ranks likely root causes by confidence and gives you the steps — JVM flags, config, and the exact code to investigate.
Create a workspace, invite your team by email or link, and every analysis is visible to the team — with roles (from Admin to Viewer) controlling who does what.
ROI calculator
Plans and pricing
For developers getting started with thread dump analysis.
For developers who need AI and full history.
For engineering teams collaborating on JVM incidents.
For large organizations with SLA, compliance and on-premise requirements.
Base prices in US dollars (US$). At checkout, your local currency is applied automatically.
PixPRO and TEAM can also be bought as a one-month pass via Pix — one-time payment, no renewal.
Product proof
No made-up traction numbers. What ThreadMine does — and you can check it on your first upload, no account needed.
HotSpot/OpenJDK, IBM OpenJ9, Azul Zing and GraalVM (JVM + Native Image) — recognized by the header, no need to tell us which one.
Deadlock, lock contention, pool exhaustion, thread leak, starvation, virtual thread pinning, DB/external-service bottlenecks and more — with severity and runbook.
A single indicator combines criticality, blocked threads and likely root cause — a diagnosis before you read a single stack line.
Flame graph, call tree and dependency graph with lock-cycle detection — to see the bottleneck, not just read it.

Frequently asked questions
Privacy, technical capabilities and how ThreadMine operates — straight answers, no fine print.
Didn't find your question? Talk to us.